Cast a vote here if you think it should move up in the Top-100 ranking:

You will be transferred to the Top-100 site, but may then return here by going "BACK"

The second model substitutes a parabolic rise to P1 and fall from P2. A parabola was chosen for arithmetic simplicity but I have to admit that it is overly "fat" compared with on-the-water data even though that data tends to have nonlinear aspects.
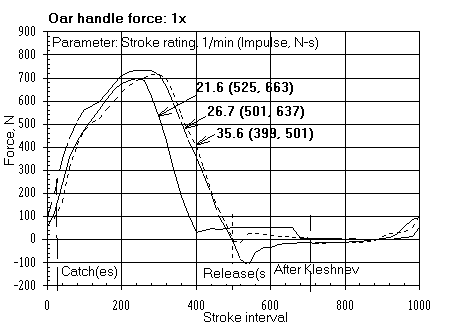
Below is a set of three force curves for a single (heavy man) at each of three stroke ratings as measured by V. Kleshnev of the AIS. They would be easily modeled with the linear representation described above.

These curves show a delayed force peak near the ninety-degree point of the oarshaft sweep.
Ideally a force curve could be completely defined as data matching actual rower's curves point-by-point. I could pretty easily do this in ROWING but will wait until there seems to be some serious interest in having it done.
For the case at hand I have used the linear model because it seems pretty well to match the empirical data taken by V. Kleshnev. Also, it seems more important to look at where in the drive the work is done than to worry about the exact shape of the curve.
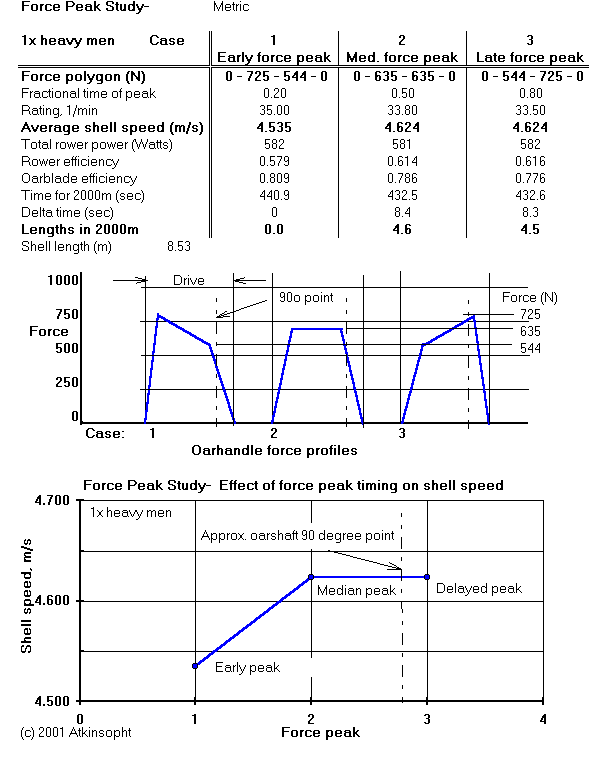
The three cases shown here were calculated at the same total rower power output (which accounts for the drop in rating at the higher speeds as the system's efficiency increases). The areas enclosed (work if the abscissa is distance; impulse if the abscissa is time) by the three force polygons are kept equal.
 Figure 1
If, in Case 3, the peak is held level (at the average 635 N) the benefit is still further improved- to six lengths- even though the polygon area is unchanged. The reason for this is not clear but I think it has to do with the fact that if the force is low when the handle speed is high less work is done than would be otherwise. The handle speed is a maximum at the 90 degree point.
Attaining the skill reliably to acquire an efficient force profile is a matter of training. It should usefully be training with the help of instrumentation which can measure and record or display force profiles- preferably on the water and in real time- as instantaneous feedback to the rower. Measuring peak pull is not simple but is becoming easier through the increasing availability of rowing data acquisition systems (RDAS) such as those described in detail in Coughlin [1].
Insofar as rowing ergometers mimic rowing it is possible to estimate peak effort by the method described in Estimating Peak Oarhandle Pull.
The benefit of peak force management applies to all boats: singles, pairs, fours, and eights.
Reference:
[1] Coughlin, Karla, T. Westenburg. "The USOC Rowing Data Acquisition
System", Sensors- Data Acquisition, Special Issue 1996, Helmers Publishing,
Inc., NH.